Retention and Graduation
East-West University participates in the U.S. Department of Education’s Integrated Post-Secondary Educational Data System (IPEDS) by contributing data on its programs and enrollment, tuition and fees, graduation and retention rates, and other facts. To view this information about East-West University visit the National Center for Educational Statistics (NCES) website.
Retention Rate
FIRST-TO-SECOND YEAR RETENTION RATES
Retention rates measure the percentage of first-time students who are seeking bachelor's degrees who return to the institution to continue their studies the following fall.
RETENTION RATES FOR FIRST-TIME STUDENTS PURSUING BACHELOR'S DEGREES
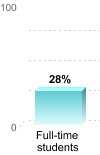
Percentage of Students Who Began Their Studies in Fall 2020 and Returned in Fall 2021
Graduation Rate
The overall graduation rate is also known as the "Student Right to Know" or IPEDS graduation rate. It tracks the progress of students who began their studies as full-time, first-time degree- or certificate-seeking students to see if they complete a degree or other award such as a certificate within 150% of "normal time" for completing the program in which they are enrolled.
Some institutions also report a transfer-out rate, which is the percentage of the full-time, first-time students who transferred to another institution.
Note that not all students at the institution are tracked for these rates. Students who have already attended another postsecondary institution, or who began their studies on a part-time basis, are not tracked for this rate. At this institution, 97 percent of entering students were counted as "full-time, first-time" in 2021.
OVERALL GRADUATION AND TRANSFER-OUT RATES FOR STUDENTS WHO BEGAN THEIR STUDIES IN FALL 2015
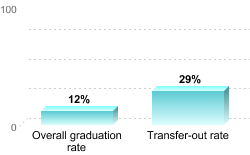
Percentage of Full-time, First-Time Students Who Graduated or Transferred Out Within 150% of "Normal Time" to Completion for Their Program
BACHELOR'S DEGREE GRADUATION RATES
Bachelor’s degree graduation rates measure the percentage of entering students beginning their studies full-time and are planning to get a bachelor’s degree and who complete their degree program within a specified amount of time.
GRADUATION RATES FOR STUDENTS PURSUING BACHELOR'S DEGREES
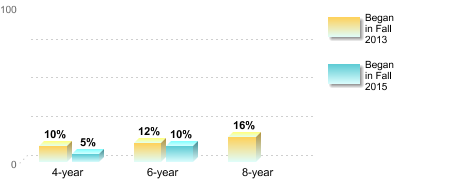
Percentage of Full-time, First-time Students Who Graduated in the Specified Amount of Time and Began in Fall 2013 or Fall 2015
6-YEAR GRADUATION RATE BY GENDER FOR STUDENTS PURSUING BACHELOR'S DEGREES
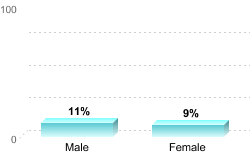
Percentage of Full-time, First-time Students Who Began Their Studies in Fall 2015 and Received a Degree or Award Within 150% of "Normal Time" to Completion for Their Program
6-YEAR GRADUATION RATE BY RACE/ETHNICITY FOR STUDENTS PURSUING BACHELOR'S DEGREES
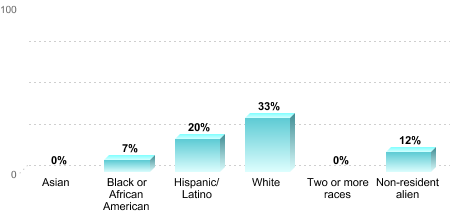
Percentage of Full-time, First-time Students Who Began Their Studies in Fall 2015 and Received a Degree or Award Within 150% of "Normal Time" to Completion for Their Program
Related Links
Ready to Change Your Course in Life?
If you are a prospective student, continue your journey with us.